
Elder Law Review

|
|
Home
| Databases
| WorldLII
| Search
| Feedback
Elder Law Review |
|
Simon Kelly[1] and Ann Harding[2]
The housing boom has helped the current generation of older Australians to be the wealthiest generation yet. Potentially this means that the baby boomers do not need to save as heavily for their retirement, as they will be the beneficiaries of this wealth through intergenerational transfers. However, this may be too simplistic.
This paper looks at data on who is currently receiving inheritances and finds that those with the least need have the greatest chance of inheriting a significant amount. In other words, the majority of baby boomers have made a mistake if they are relying on an inheritance to fund their retirement.
The Australian Treasury found that real net wealth per Australian had grown for 13 consecutive years and had risen by $51,300 in the three years to June 2004 alone (to $250,000 per Australian) (2005, p.88). However, the distribution of this wealth is very uneven. Research suggests that the richest ten per cent own just under half of all the household wealth (Kelly 2001; Headey et al. 2004). The key source of the net wealth of households is the equity in their home — and, hence, the main reason for the strong growth in the last decade or so has been the housing price boom. Older Australians, who predominately own their home outright, have been major beneficiaries of this increase in net worth. Various researchers have noted that the value of assets owned by the current generation of retirees is significantly higher than that of previous generations (Harding et al. 2002; Lim-Applegate et al. 2005). However, while older Australians are wealthy on paper, realising the majority of their wealth requires them to sell their home and this is unlikely to happen. In general, current retirees would rather live frugally in an asset worth hundreds of thousands of dollars than borrow against this asset to pay for a higher standard of living.
It could be assumed that the children of these current retirees (the ‘baby boomers’) will inherit this wealth that has been amassed and not consumed by their parents. Many of the baby boomers, while they have also enjoyed the growth in housing wealth, have not saved enough to ensure a financially comfortable retirement (Kelly and Harding 2002; Kelly et al. 2004). In general they are not frugal with their money, enjoy a higher standard of living than their parents and are quite comfortable living with debt. While debt can be accommodated while working, it seems the living standards they will be able to afford in retirement will be considerably less than they have become accustomed to during their working lives. The gap between their retirement expectations and low retirement savings suggests that many baby boomers may be relying on an inheritance from their parents to bridge difference.
This paper reports on inheritance data collected as part of the HILDA survey. This longitudinal survey has collected data on who received inheritances and the amount they received. It provides the first Australian data on this important subject and suggests that baby boomers that are relying on this windfall to help finance their retirement may be making a mistake.
In the past people died younger; families were bigger; housing prices did not appreciate as dramatically; and it was uncommon to own assets like shares. As a result most families had modest wealth — and therefore most inheritances were relatively small.
Today and into the future, inheritances should be larger as increased life expectancies will provide more time for wealth to grow. In addition, smaller families mean the ‘pieces of the pie’ will be larger — while the wealth of older Australians is increasing, thanks to the housing and stock market booms of the 1980s and 1990s. In theory, it should be a bonanza for intergenerational transfers.
Just as the net worth of older Australians is increasing, Swedish (Klevmarken 2001) and Italian (Brandolini et al. 2002) studies have shown similar results in those countries. It seems in a number of countries, older peoples’ share of the ‘wealth pie’ is increasing.
In the United States, Americans aged 64 and over were worth $US 5.3 trillion in 1991 (Wolff 1991) — but by 1999, the estimate had increased to at least $US 41 trillion (Haven and Schervish 2003). If all of this money was transferred evenly to the baby boomers, they would receive $US 540,000 each. However, this highlights a major issue for the baby boomers: the inherited wealth will not be evenly distributed.
There are many reasons why the distribution of inheritances will not be even. The first is that the wealth is highly skewed and this is particularly true for older Australians. The inequality of the distribution of wealth is far greater than the distribution of income. Kelly and Harding (2003) estimate that the richest one-fifth of those aged 65 and over in 2002 owned 63 per cent of all the wealth held by this age cohort — or, conversely, 80 per cent of the elderly controlled only 37 per cent of the wealth. This suggests that the chances of a large inheritance are quite small. This low chance of receiving a large inheritance was confirmed some years ago by King and McDonald (1999). They found that only 5.7 per cent of those asked in an Australia-wide survey in 1998 had received an inheritance of more than $10,000 in the previous ten years. In fact the chances of inheriting anything at all are quite small. O’Dwyer (2001) found that only one per cent of South Australians received any inheritance in the preceding 12 months. In the UK, only 43 per cent of people who died in 1998-99 left an estate (Hancock et al. 2002) and in the USA only 1.6 per cent reported that they ever received an inheritance of $100,000 or more (Gokhale and Kotlikoff 2000).
There are a number of other factors that count against the baby boomers receiving an intergenerational windfall. Firstly, the medical breakthroughs and advances in technology that are allowing people to live longer come at considerable cost (Productivity Commission 2005). The private contribution to these health and aged care costs can be expected to increase in the future and this will reduce the nest egg to transfer.
Secondly, the parents may choose to spend it on themselves rather than live frugally and leave it all to their children. A recent survey of people aged 50 and over found a significant shift in the values and priorities of older Australians with the emergence of a change towards values of consumption and lifestyle. Likewise their attitude to their children is beginning to shift from one of self sacrifice to one of self interest. This change in attitude is reflected in one-quarter of respondents expecting to consume all of their assets before they die (Olsberg and Winters 2005).
Many researchers have suggested that the desire to bequeath assets to the next generation has begun to diminish (Olsberg and Winters 2005; Zhang and Zhang 2001; Takayama et al. 1996). The reasons for this include increased complexity due to remarriage and new relationships; reduced altruism (the children do not need it); children no longer living near their parents and hence the promise of a bequest cannot be used to influence behaviour; a greater focus on independence; and the gradual change in values towards consumption and lifestyle.
Finally, living longer means that the next generation may well be approaching retirement by the time they inherit. The parents may well perceive that the children do not need the inheritance as they are well past the high cost years of establishing a family and home. This has led to some parents choosing to ‘generation skip’ - that is, leaving it to the grandchildren - with others leaving the majority of it to charity.
In summary, while most baby boomers believe that they will benefit from the increased wealth of older people, researchers are suggesting that the reality may be somewhat different. They suggest that a number of factors and trends diminish the chances of them receiving a large inheritance. This paper provides the first quantitative data based on an Australia-wide survey to support the discussion.
The Household, Income and Labour Dynamics in Australia (HILDA) Survey is a household-based panel survey conducted by the Melbourne Institute of Applied Economic and Social Research at the University of Melbourne for the Department of Family and Community Services. The survey tracks all members of an initial sample of households over an indefinite life – the first eight waves (years) are currently funded. The HILDA Survey collects data in three main areas: economic and subjective wellbeing, labour market dynamics and family dynamics and covers 14,000 people in 7,200 households. The respondents to the survey are weighted to give representative values for the entire Australian population. This paper uses data from the first three waves, which were conducted in 2001, 2002 and 2003.
In each wave, the survey asked the respondents whether they had received an inheritance in the last financial year. If they had received an inheritance, the amount received was recorded. In the first wave only 0.2 per cent of the population said they received an inheritance in the previous financial year. The mean amount received was $18,400. Based on this survey, $0.525 billion was inherited during the financial year.
The proportions of the population receiving inheritances in the second and third waves are considerably higher than in the first wave. In 2002, 1.4 per cent of the adult population received an inheritance and the same proportion received an inheritance in 2003 (Table 1). Similarly the mean, median and total amounts transferred in the first wave are substantially less than in the second and third waves. This suggests that the findings in the first wave do not fully capture the inheritances received in that year.
|
|
Number receiving an inheritance
|
Proportion of adult population
|
Amount inherited (median)
|
Amount inherited (mean)
|
Total Amount inherited
|
|
|
No.
|
%
|
$
|
$
|
$Billions
|
|
2001 (Wave 1)
|
28,445
|
0.2
|
10,400
|
18,446
|
0.525
|
|
2002 (Wave 2)
|
221,614
|
1.4
|
20,000
|
59,556
|
12.762
|
|
2003 (Wave 3)
|
222,009
|
1.4
|
20,000
|
67,588
|
14.815
|
|
|
|
|
|
|
|
Source: HILDA Survey, Waves 1, 2, and 3
Given the differences between the first and remaining waves, only the second and third waves are considered to be reliable and the first will not be used in the remaining analyses. In the HILDA survey waves 2 and 3, a combined total of 373 people stated they received an inheritance and provided the amount of inheritance received. An additional 11 responses stated they received an inheritance but did not disclose the amount received.
An average of 1.4 per cent of the Australian population aged 15 year s and over (approximately 220,000 people) received an inheritance in each of the years 2002 and 2003 according to the HILDA surveys. This is slightly higher than the one per cent estimated by O’Dwyer (2001) based on South Australian data. The mean age of those receiving an inheritance was 48 years and there was little difference in the distributions by age (Figure 1). Both distributions started low (around 0.2 per cent) for young adults, grew to a peak (around 3.0 per cent) for those aged in their fifties and then declined. The proportion of people aged 50 to 59 years receiving inheritances was 14 times the proportion aged under 20 years; 3.5 times those aged 20 to 29 years; and 2.5 times those aged 70 years and over.
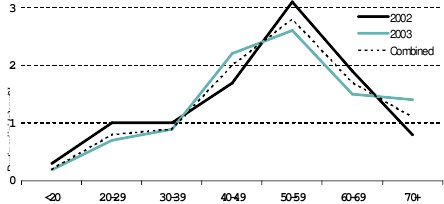
Source: HILDA Survey, wave 2 and wave 3
In addition to differing rates by age there were some gender-based differences. Of the estimated 443,600 people that received an inheritance in either 2002 or 2003, 59 per cent (263,000) were females (Table 2). Males outnumbered females in the three youngest age groups but, for all the other age groups, the number of females receiving inheritances exceeded the number of males.
|
Age group
|
People receiving inheritances
|
Proportion Female
|
||
|
Males
|
Females
|
Persons
|
||
|
|
No.
|
No.
|
No.
|
%
|
|
Less than 20 years old
|
4,300
|
2,700
|
7,000
|
38.5
|
|
20-29 years old
|
24,900
|
21,300
|
46,300
|
46.1
|
|
30-39 years old
|
27,800
|
27,500
|
55,300
|
49.7
|
|
40-49 years old
|
42,600
|
75,800
|
118,400
|
64.0
|
|
50-59 years old
|
46,100
|
83,900
|
130,000
|
64.5
|
|
60-69 years old
|
20,400
|
31,400
|
51,800
|
60.7
|
|
70+ years old
|
14,600
|
20,300
|
34,900
|
58.2
|
|
All ages
|
180,700
|
263,000
|
443,600
|
59.3
|
Note: This is the total number of recipients in the two years, summing both 2002 and 2003 data.
Source: HILDA Survey, wave 2 and wave 3
The age group receiving the most inheritances were those aged 50 to 59 years. Of the estimated 130,000 people in this age group receiving an inheritance, almost two-thirds were females (64.5 per cent).
Differences in the numbers of females and males receiving inheritances may simply reflect the differing gender-age profiles (for example, there are many more women aged 85 and over than there are men of this age). It may be that the proportions of men and women in each age group receiving an inheritance are similar. To examine this, the proportions by age and gender are presented in Table 3.
For younger ages, the proportions receiving inheritances are similar for both genders. For example, the female rate for 30-39 year olds is 0.9 per cent and the same value is found for males of that age. However, the female rates for the 40-49 and 50-59 age groups are 1.8 times their male counterparts. For example the rate for 40 to 49 year old females is 2.5 per cent, while the male rate is 1.4 per cent. This could be interpreted as a consequence of males having higher death rates then females at ages 40 and over. However, detailed analysis of the data shows that only a very small proportion of those receiving inheritances also became widowed. In other words an extremely small proportion of the inheritances relate to husbands leaving their money to their wives and the higher inheritance rate for women aged 40 and over cannot be explained by this behaviour.
|
Age group
|
Proportion receiving inheritances
|
||
|
Males
|
Females
|
Persons
|
|
|
|
%
|
%
|
%
|
|
Less than 20 years old
|
0.3
|
0.2
|
0.2
|
|
20-29 years old
|
0.9
|
0.8
|
0.8
|
|
30-39 years old
|
0.9
|
0.9
|
0.9
|
|
40-49 years old
|
1.4
|
2.5
|
2.0
|
|
50-59 years old
|
2.0
|
3.6
|
2.8
|
|
60-69 years old
|
1.3
|
2.1
|
1.7
|
|
70+ years old
|
1.0
|
1.1
|
1.1
|
|
All ages
|
1.2
|
1.7
|
1.4
|
Note: The values shown are averages from the combined 2002 and 2003 data.
Source: HILDA Survey, wave 2 and wave 3
The multiple of the female rate to the male rate begins to fall for the 60-69 age group, but is still a considerable 1.6 times. For the 70 and over age group, the proportions are roughly the same. Overall, 1.7 per cent of females received an inheritance while the proportion of males receiving an inheritance was only 1.2 per cent.
The amounts inherited over the two years varied between $75 and $1,000,000. The mean inheritance was $63,600.[3] The mean in 2003 was $67,600; an increase of 13.5 per cent ($8,000) on the 2002 value. The difference in overall means by gender was insignificant, with $63,000 for males and $64,000 for females. The median inheritances for both genders and both years were $20,000. The large difference between the mean and the median indicates that the distribution by amount was highly skewed, with a large number of small inheritances at one end and a small number of very large inheritances at the other end. This is evident in Table 4, with more than half (51.3 per cent) receiving less than $20,000. The inequality of the distribution is also apparent in the share of the total amount received. Less than one per cent of the inheritances received were greater than $500,000 — but the 3,700 inheritances made up almost 13 per cent of the total amount transferred. Conversely, the 222,300 people receiving less than $20,000 only represent 5.8 per cent of the total amount transferred.
|
Amount received
|
Number of recipients
|
Proportion of recipients
|
Share of total amount inherited
|
|
|
|
|
|
|
$1 - $20,000
|
222,300
|
51.3
|
5.8
|
|
$20,001 - $40,000
|
56,300
|
13.0
|
6.5
|
|
$40,001 - $60,000
|
32,900
|
7.6
|
6.2
|
|
$60,001 - $80,000
|
20,400
|
4.7
|
5.3
|
|
$80,001 - $100,000
|
24,100
|
5.6
|
8.1
|
|
$100,001 - $150,000
|
31,600
|
7.3
|
15.2
|
|
$150,001 - $200,000
|
18,500
|
4.3
|
12.2
|
|
$200,001 - $300,000
|
13,700
|
3.2
|
13.3
|
|
$300,001 - $400,000
|
4,400
|
1.0
|
5.7
|
|
$400,001 - $500,000
|
5,700
|
1.3
|
9.1
|
|
$500,001+
|
3,700
|
0.9
|
12.7
|
Note: This table is based on the total number of recipients in the 2002 and 2003 data.
Source: HILDA Survey, wave 2 and wave 3
As net worth generally rises with age (at least until retirement), it could also be expected that the average amount received follows a similar path (Harding et al. 2003). Figure 2 shows this to be the case. While the overall average inheritance is $64,000, the average for a person aged less than 20 years is $8,900 [4] and the average for a person aged 60 to 69 years is $93,200. In relative terms, the young person receives an inheritance one-seventh of the mean; an average person in the 60-69 age group receives an inheritance one-and-a-half times the mean; and the average for a person aged 70 years and over is 90 per cent of the mean.
Despite the peak in the mean inheritance occurring at age 60 to 69, the higher numbers of recipients in the 50 to 59 year age group results in them taking a larger share of the inheritance ‘pie’. As the blue line on Figure 2 shows, one-third (35.1 per cent) of the total amount being transferred goes to this age group. A total of 81 per cent of the total value of inheritance received is by those in the three age groups aged between 40 and 69 years.
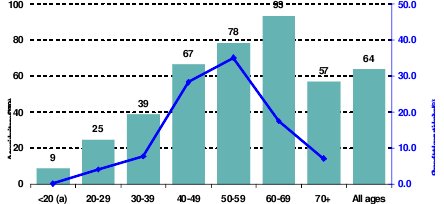
a There were only a small number of observations for this age group and the mean may be unreliable
Note: This figure uses the total number of recipients in the 2002 and 2003 data.
Source: HILDA Survey, wave 2 and wave 3
Some research suggests that rich households have a greater chance of inheriting than poor households (for example, Kelly and Harding 2003). In this section each household has been ranked in two different ways, based on total household income and household net worth. The reference year for income and net worth is 2002. After ranking by total household income, households in the bottom 20 per cent were assigned to the first income quintile, the next 20 per cent to the second income quintile and so on. The ranking process was then repeated based on household net worth. Wealth quintiles were then assigned.
Table 5 shows the number of people receiving inheritances in each of the income quintiles; the proportion of all beneficiaries; the mean inheritance; and the share of the total amount inherited. This table provides some support for the theory that those on a higher income have a better chance of inheriting. There does appear to be a slight bias towards those in high income households. The two highest income quintiles, representing 40 percent of the population, received 49.3 per cent of the inheritances. Recipients in the top income quintile also received 30 per cent of all the inheritances transferred. It should also be noted that the age of recipients probably clouds the picture here, as the relatively high average amount inherited by households in the bottom income quintile probably reflects the greater likelihood of older Australians being found in this quintile (with incomes after retirement typically being much lower than incomes during the peak working years).
|
Household Income Quintile
|
Number receiving an inheritance
|
Proportion of recipients
|
Mean inheritance
|
Share of total amount inherited
|
|
|
No.
|
%
|
$
|
%
|
|
Q1 (lowest)
|
62,900
|
16.2
|
80,100
|
20.2
|
|
Q2
|
64,700
|
16.7
|
43,500
|
11.3
|
|
Q3
|
69,100
|
17.8
|
54,200
|
15.0
|
|
Q4
|
99,800
|
25.7
|
58,900
|
23.6
|
|
Q5 (highest)
|
91,500
|
23.6
|
81,500
|
29.9
|
Note: This table is based on the total number of recipients in the 2002 and 2003 data.
Source: HILDA Survey, wave 2 and wave 3
Table 6 is a similar table to Table 5 except that the people receiving inheritances have been ranked by their household net worth. While the relationship between household income and inheritances was relatively weak, the relationship between household net worth and inheriting is much stronger. Table 6 shows that the number receiving inheritances increases as household net worth increases. The proportion of recipients starts at ten per cent for the poorest quintile and then progressively increases by about four percentage points as the quintile levels climb. The final result is that almost three times as many recipients were in the richest quintile (112,100 recipients or 28.9 per cent) than in the poorest quintile (40,700 or 10.5 per cent).
|
Household Net Worth Quintile
|
Number receiving an inheritance
|
Proportion of recipients
|
Mean inheritance
|
Share of total amount inherited
|
|
|
No.
|
%
|
$
|
%
|
|
Q1 (poorest)
|
40,700
|
10.5
|
47,200
|
7.7
|
|
Q2
|
62,000
|
16.0
|
26,600
|
6.6
|
|
Q3
|
79,200
|
20.4
|
48,800
|
15.5
|
|
Q4
|
94,000
|
24.2
|
68,100
|
25.7
|
|
Q5 (richest)
|
112,100
|
28.9
|
99,000
|
44.5
|
Note: This table is based on the total number of recipients in the 2002 and 2003 data.
Source: HILDA Survey, wave 2 and wave 3
The extraordinarily clear relationship between net worth quintile and proportion of recipients is not quite as clear for the average amount inherited but there does still seem to be a relationship. From the second to the fifth quintile, the mean inheritance amount is greater for those from richer households. Those in the richest quintiles inherited assets with a mean value of $99,000, almost four times the average of those in the second lowest quintile ($26,600).
Given the higher average inheritance amounts and the higher number of recipients in the top net worth quintile, it is not surprising that people from this 20 per cent of households inherited 44.5 per cent of the total amount on offer.
Note: This table is based on the total number of recipients in the 2002 and 2003 data.
Source: HILDA Survey, wave 2 and wave 3
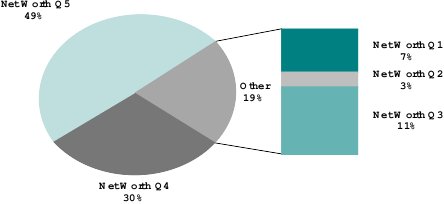
From our division of households into wealth quintiles, we know that the maximum net worth a household can have and still be in the poorest wealth quintile is $15,200. For a household with net worth of $15,200 or less, the inheritance of $100,000 would be a very significant event – a life changing event. Unfortunately, while it has already been highlighted in Table 4 that only 18 per cent of inheritances are more than $100,000, only seven per cent of those go to people living in a Wealth Quintile 1 household (Figure 3). This means that only about one in every 100 people in the bottom wealth quintile who receive an inheritance receive a windfall worth $100,000 or more. Even fewer go to Quintile 2 – three per cent of all those receiving inheritances over $100,000, or about one in every 200 receiving an inheritance in this quintile. Almost half (49 per cent) of all $100,001 plus inheritances go to those in the richest wealth quintile (with the minimum household net worth to qualify for this quintile being $491,500), and a further 30 per cent goes to the second richest quintile.
Inheritance is a topic that will assume greater prominence in the coming decades, as the large baby boom cohort reaches retirement age and begins to place major fiscal strains upon government budgets (Productivity Commission, 2005). Governments will be interested in the capacity of the retired baby boomers to meet a greater share of their health, aged care and other costs — an interest that will be shared by the generations of taxpayers following the baby boomers. Given that many of the baby boomers do not yet appear to have saved enough for a financially comfortable retirement, the possible receipt of an inheritance will be of great importance to both the boomers and to governments. The extent of inequality in the distribution of wealth is also one of the important indicators of economic well-being in a society.
Our study suggests that the chances of a person receiving an inheritance that will provide them with a significant retirement income or a significant supplement to the Age Pension are slim. The key source of wealth for older Australians is their home: given that about three in every 10 Australians aged 75 years and over did not own their own home at the end of the 1990s (Harding et al. 2002b, p. 5), this implies that at least 30 per cent of their children will not be likely to receive any inheritance from the eventual sale of the family home. Only about 1.4 per cent of adults receive an inheritance in any given year. Half of these inheritances are less than $20,000 and the average age of a beneficiary is middle aged (48 years old). Such an inheritance is likely to be consumed well before retirement.
Household net worth in Australia is already unevenly distributed. The richest 20 per cent have about three times the level of the second highest quintile and 15 times the second poorest quintile (RBA 2004). The findings from our research are that both the numbers of inheritance recipients and the amount received increase with household net worth. In fact, almost half of the total amount inherited (44.5 per cent) went to those already living in the richest one-fifth of Australia’s households. On average, households living in the wealthiest quintile were two to three times as likely to receive an inheritance as those living in the bottom two wealth quintiles and their average inheritances were two to four times greater. These results suggest that whether or not a baby boomer has received a large inheritance may emerge as one of the great divisors in the future — and may help to further skew the distribution of wealth by increasing the share held by the richest households.
The inequality of the distribution of inheritances and the low median level suggest that baby boomers relying on an inheritance to bridge the gap between their retirement expectations and the current lack of retirement savings will be in trouble. The majority of large inheritances go to people who are already financially secure.
Brandolini, A., Cannari, L., D’Alessio, G. and Faiella, I. Household Wealth Distribution in Italy (2002) (Paper prepared for the 27th General Conference of the International Association for Research in Income and Wealth, Sweden, August).
Edwards, G., Regan, S., and Brooks, R, Age Old Attitudes: Attitudes Towards Planning for Retirement, Means-testing, Inheritance and Informal Care (2001) Institute for Public Policy Research, London.
Gokhale, J. and Kotlikoff, L. The Baby Boomers’ Mega-Inheritance – Myth or Reality?, (2000) Federal Reserve Bank of Cleveland, www.clev.frb.org/research/com2000/1001.htm, accessed 1 May 2003.
Hancock, R., Katbhamna, S., Martin., G., Clarke, H., and Stutchbury, R. Attitudes to Inheritance: An Exploratory Study (2002) Joseph Rowntree Foundation UK available at www.jrf.org.uk/bookshop/eBooks/1842631160.pdf
Harding, A., Kelly, S. and Bill, A. ‘Generation Xcluded’ AMP.NATSEM Income and Wealth Report (2003), November (all AMP.NATSEM reports available from www.amp.com.au)
Harding, A., King, A and Kelly, S. ‘Incomes and Assets of Older Australians: Trends and Policy Implications’,(2002a) 9(1) Agenda 3-18.
Harding, A., King, A. and Kelly, S., The Income and Wealth of Older Australians – Trends and Projections (2002b) (paper prepared for the Departments of Housing (NSW) and Ageing, Disability & Home Care Industry Development Forum, Sydney, 18 February).
Haven, J. and Schervish, P, “Why the $41 Trillion Wealth Transfers Estimate is Still Valid: A Review of Challenges and Questions” (2003) 7(1) The Journal of Gift Planning 11-15, 47-50.
Headey, B., Marks, G. and Wooden, M., The Structure and distribution of Household Wealth in Australia (2004) Melbourne Institute working Paper No. 12/04.
Kelly, S., Trends in Australian Wealth – New Estimates for the 1990s (2001) (Paper presented to the 30th Annual Conference of Economists, University of Western Australia, September).
Kelly, S., Simulating Future Trends in Wealth Inequality (2002) (Paper presented to the Annual Conference of Economists, Adelaide, South Australia, October).
Kelly, S. and Harding, A., 'Live Long and Prosper? The Income and Wealth of Those About to Retire', (2002) AMP. NATSEM Income and Wealth Report, Issue No 2, May.
Kelly, S. and Harding, A., “Wealth and Inheritance – You Can’t Rely on the Old Folks’ Money”, (2003) AMP-NATSEM Income and Wealth Report, Issue No 5, June.
Kelly, S., Farbotko, C., and Harding, A., ‘The Lump Sum: Here Today, Gone Tomorrow’, (2004) AMP-NATSEM Income and Wealth Report, Issue No 7 March.
King, A. and McDonald, P., Private Transfers across Australian Generations (1999) Discussion Paper No. 41 National Centre for Social and Economic Modelling University of Canberra, March.
Klevmarken, N., On the Wealth Dynamics of Swedish Families 1984-1998, (2001) No. 2001:17, Working Paper Series Department of Economics Uppsala University.
Lim-Applegate, H., Mclean, P., Lindenmayer, P. and Wallace, B. New Age Pensioners: Trends in Wealth (2005) (Paper presented at the SPRC Australian Social Policy Conference University of New South Wales 20-22 July).
Olsberg, D. and Winters, M. Ageing in Place: intergenerational and interfamilial housing transfers and shifts in later life, (2005) Final report for the Australian Housing and Urban Institute, Melbourne.
O'Dwyer, L., ‘The Impact of Housing Inheritance on the Distribution of Wealth in Australia’, (2001) 36(1) Australian Journal of Political Science 83-100.
Productivity Commission, Economic Implications of an Ageing Australia, Canberra, 2005
RBA (Reserve Bank of Australia), ‘The composition and distribution of household assets and liabilities: Evidence from the 2002 HILDA survey’ Reserve Bank of Australia Bulletin (2004) April, 1-12.
Takayama, N., Horika, C.Y. and Ohta, K., Savings, Bequests and Inheritance in an Ageing Society, (1996) IPTP Research Series Institute for Posts and Telecommunications Policy Japan.
Treasury 2005, ‘Australian net private wealth’, Economic Roundup Summer 2004-05, Treasury, Canberra, March pp. 85-98.
Wolff, E. , ‘The Distribution of Household Wealth: Methodological Issues, Time Trends, and Cross-Sectional Comparisons’ (1991) in L. Osberg (ed), Economic Inequality and Poverty: International Perspectives Sharpe New York 92-133.
Zhang, J. and Zhang, J. ‘Bequest Motives, Social Security, and Economic Growth’, (2001) 39(3) Economic Enquiry July 453-466.
[1] Simon Kelly is a Principal Research Fellow at the National Centre for Social and Economic Modelling (NATSEM). He can be contacted at simon.kelly@natsem.canberra.edu.au
[2] Ann Harding is the inaugural director of NATSEM and Professor of Applied Economics and Social Policy at the University of Canberra
[3] The mean is a population-weighted average of those that indicated they received an inheritance and provided the amount received (N=373). 11 respondents indicated they had received an inheritance but did not provide the amount.
[4] Due to the small number of people in this young age group receiving an inheritance (N=5), the mean may be unreliable.
AustLII:
Copyright Policy
|
Disclaimers
|
Privacy Policy
|
Feedback
URL: http://www.austlii.edu.au/au/journals/ElderLawRw/2006/5.html